炒一锅基于深度学习的图像检索工具
炒一锅基于深度学习的图像检索工具
本文介绍如何快速搭建一个基于深度学习的图像检索工具
原料
- 数据集: Caltech256 包含从 Google 图像搜索和PicSearch.com上获得的 30, 607张物体的图像.这些图像通过人工判别被分配在257个类别中. 在这个实验里我们把Caltech256作为我们要检索的图片库. 下载
- 代码: 多伦多大学的老师 Michael Guerzhoy 在个人网站上提供了 AlexNet 的 TensorFlow 实现及权重(weights). 搭建一台能够训练深度学习模型的机器不容易,更不要说训练一个好的模型要花多少时间了, 而有了这个训练好的模型,大家就可以快速的体验深度学习的魅力.
下载权重(bvlc_alexnet.npy)
厨具
- 安装Python及相关库(TensorFlow等), 建议安装Anaconda.
菜谱
- 切菜: 修改图像大小
训练的 AlexNet 模型的输入图片的大小是固定的[227, 227],而 Caltech256 中的图片宽高是不固定的.image_resize.py可以将某一目录的下的图片批量resize,并保存到另一个目录下. 在终端中敲下python ./visual_search/tools/image_resize.py -h查看使用说明.
1 | usage: image_resize.py [-h] [--input_data_dir INPUT_DATA_DIR] |
- 开火煮: 提取图像特征
用visual_search/myalexnet_feature.py提取图片库中每张图片的特征. 这个脚本会输出两个文件:一个图片的特征,一个是所有图像的完整路径.
1 | $ cd visual_search |
上菜
在visual_search/visual_search.py脚本里修改图片特征的路径和图像名称的路径可以进行图片检索了. 输入图像可以是本地图片也可以一个图片的链接地址.
1 | usage: visual_search.py [-h] [--img_file_path IMG_FILE_PATH] |
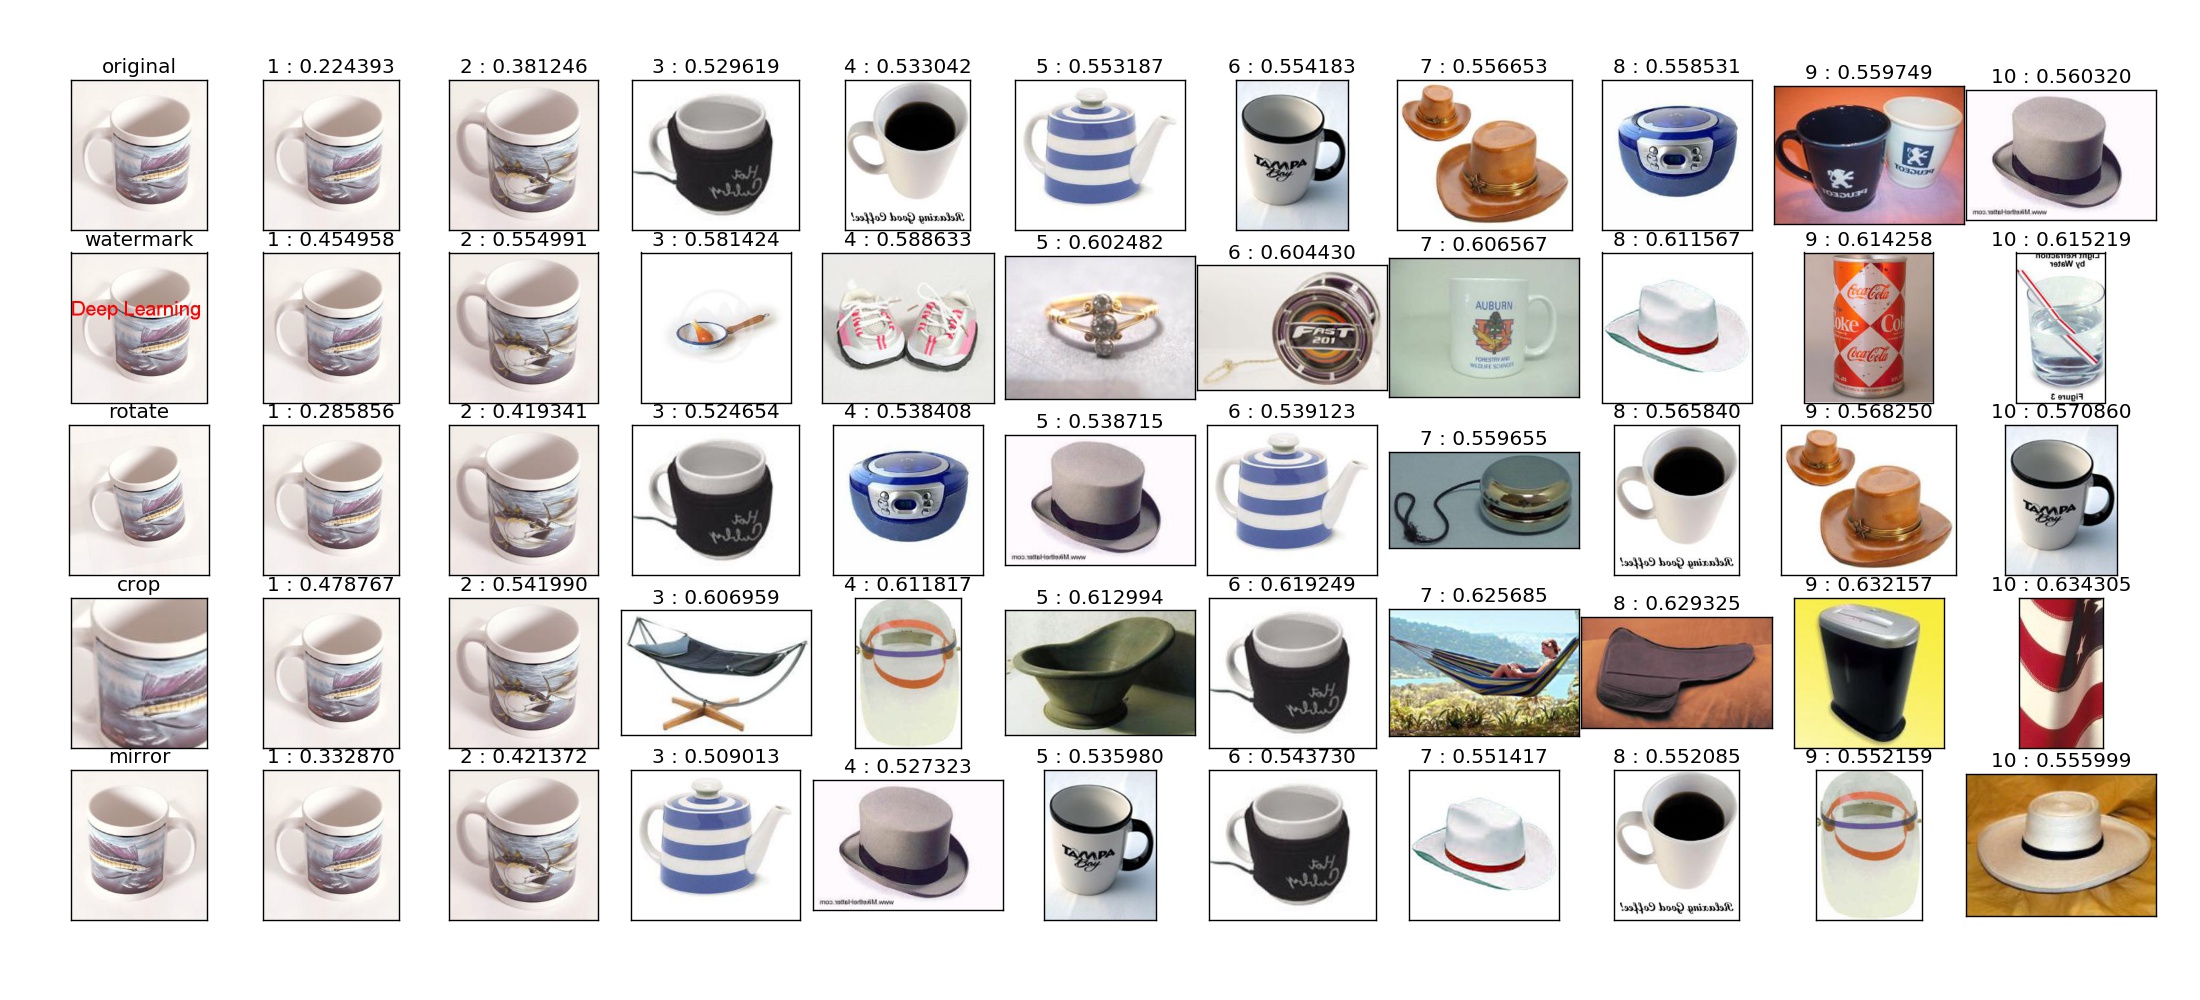
你会发现有好几行图片,其实每一行都是一个检索记录. 输入图像是每一行的第一张图片. 第2到5行的输入图像是分别对原始图像进行加水印,旋转,裁剪,镜像操作得到.
做这个实验项目其实花了不到一周的业余时间,根据我提供的信息,相信大家可以在很短的时间内做出一套自己的基于深度学习的图像搜索工具.
项目地址: https://github.com/GYXie/visual-search
博客: 炒一锅基于深度学习的图像检索工具
由于时间问题,很多细节没有写,以后会补上.如果有问题,可以在博客下留言.
可视化/画图工具推荐
图形在数据科学里的重要性无需赘言,所谓“一图胜一言”。笔者将在本文总结用过的一些画图工具,作为大家以后在选择画图解决方案的一个参考。
所见即所得式画图工具
此类工具适合绘制非结构化的数据,比如流程图。
- draw.io
这个一个国外的免费画图网站。(国内访问可能需要翻墙。)界面是这样的: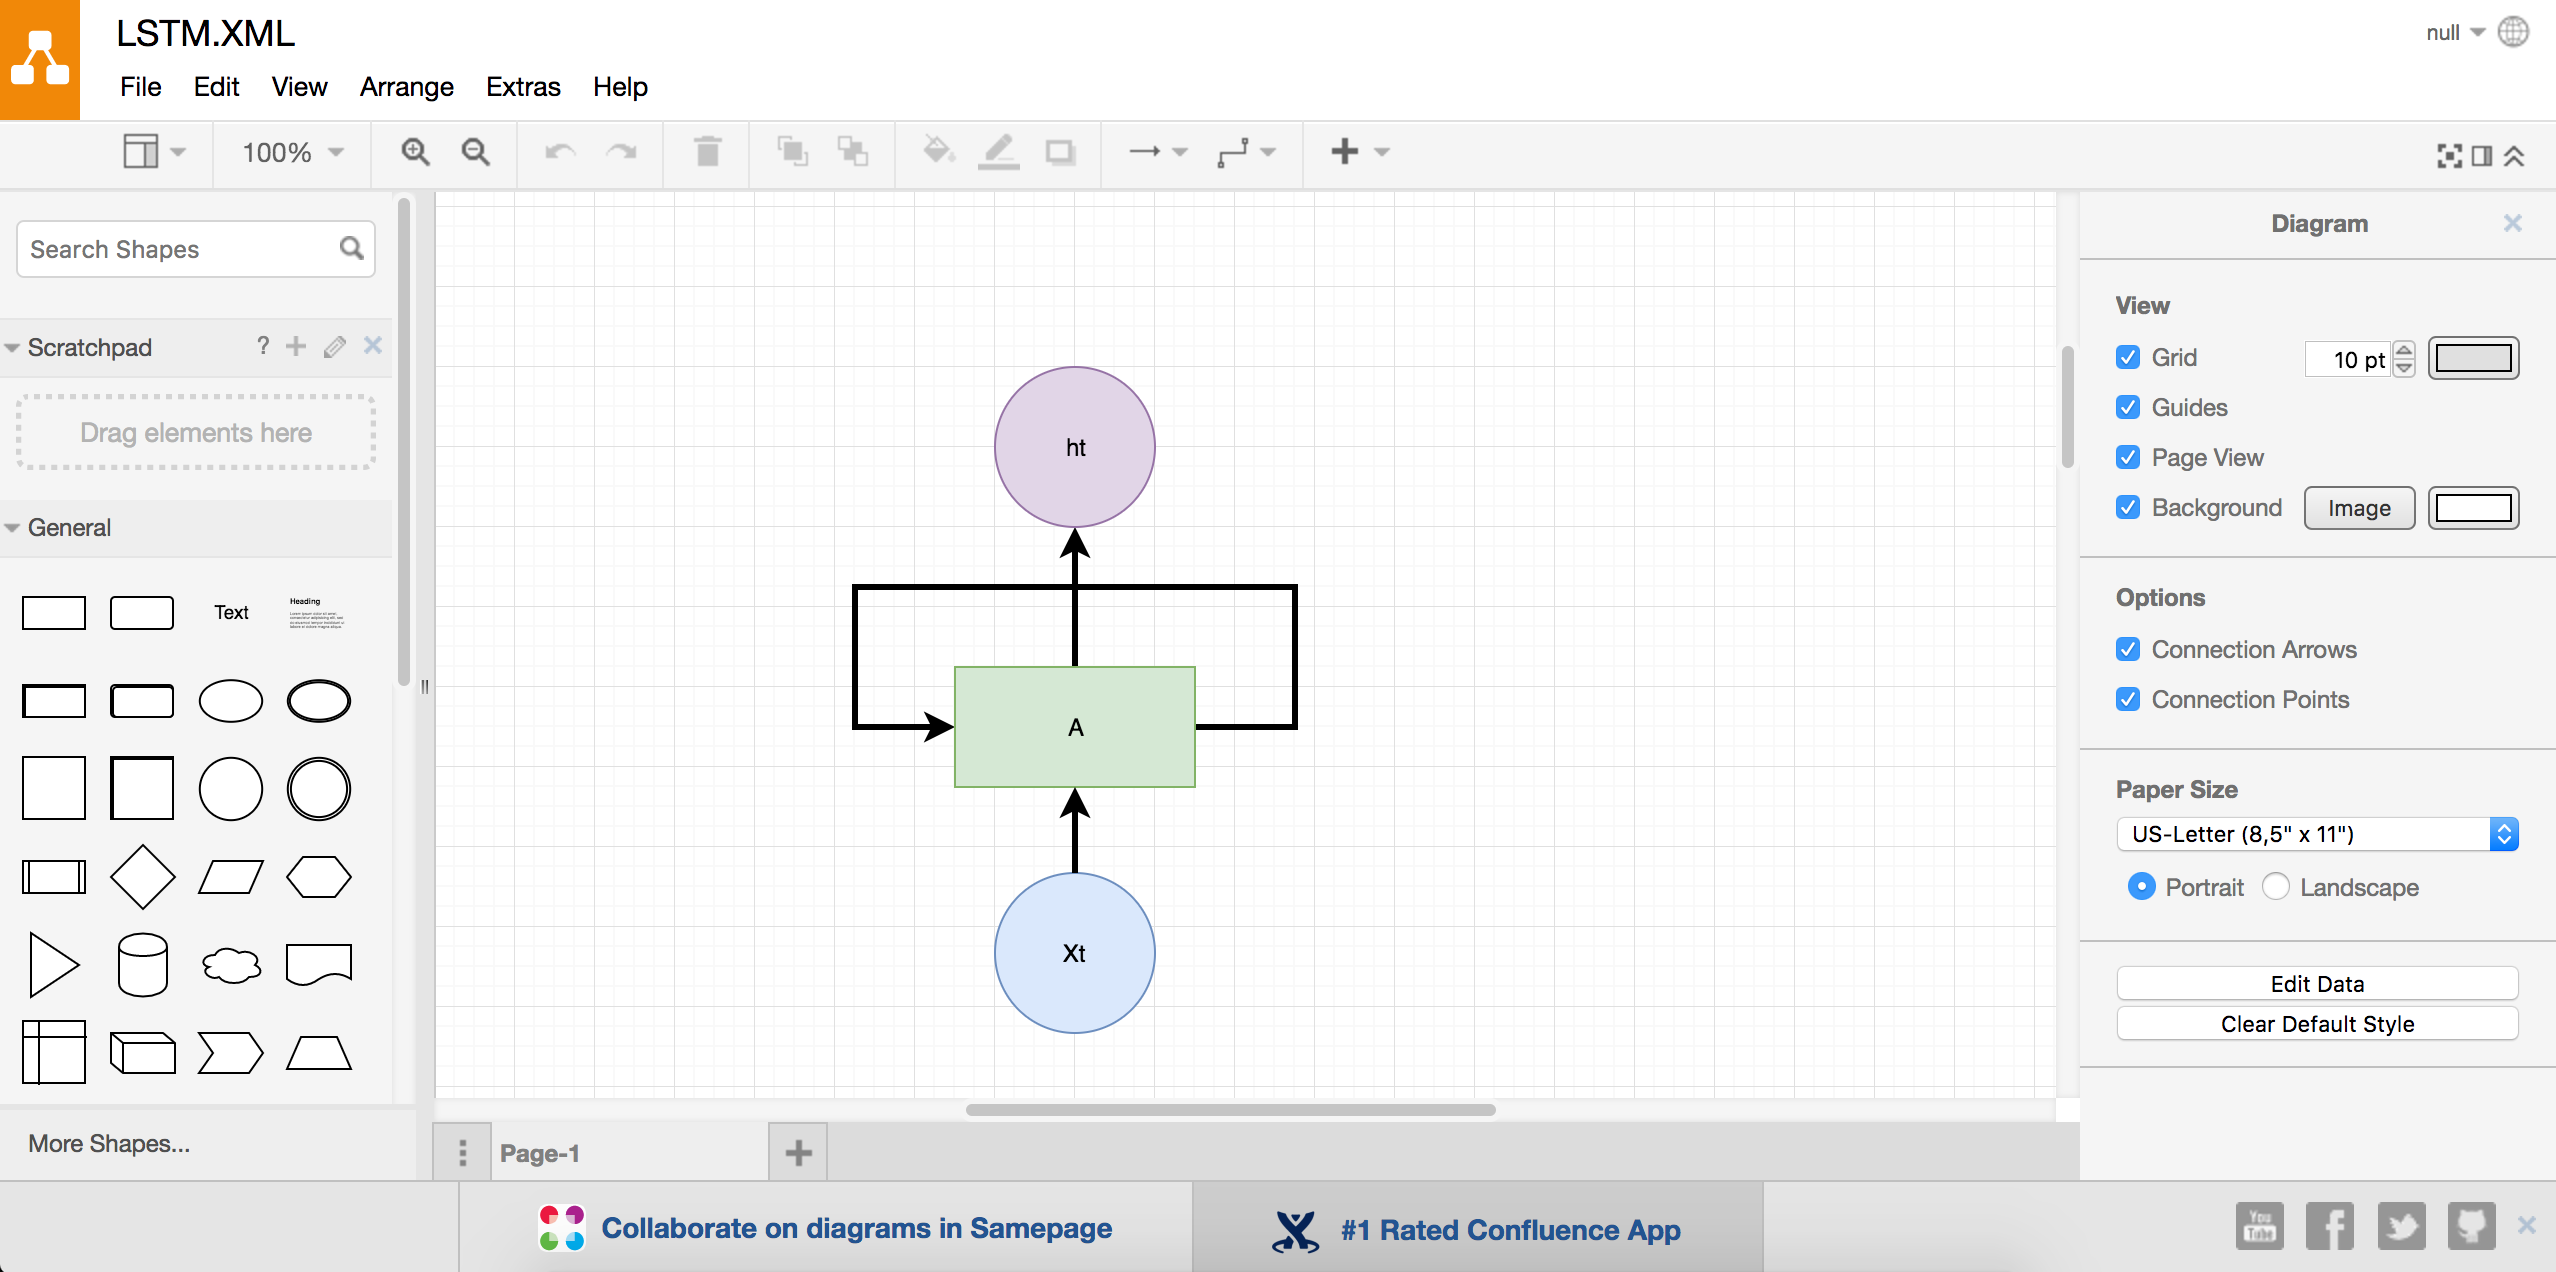
- ProcessOn
这是国内出的一个在线绘图网站,还有实时协作的功能。支持流程图,思维导图,原型图,UM,网络拓扑图等。它的界面如下: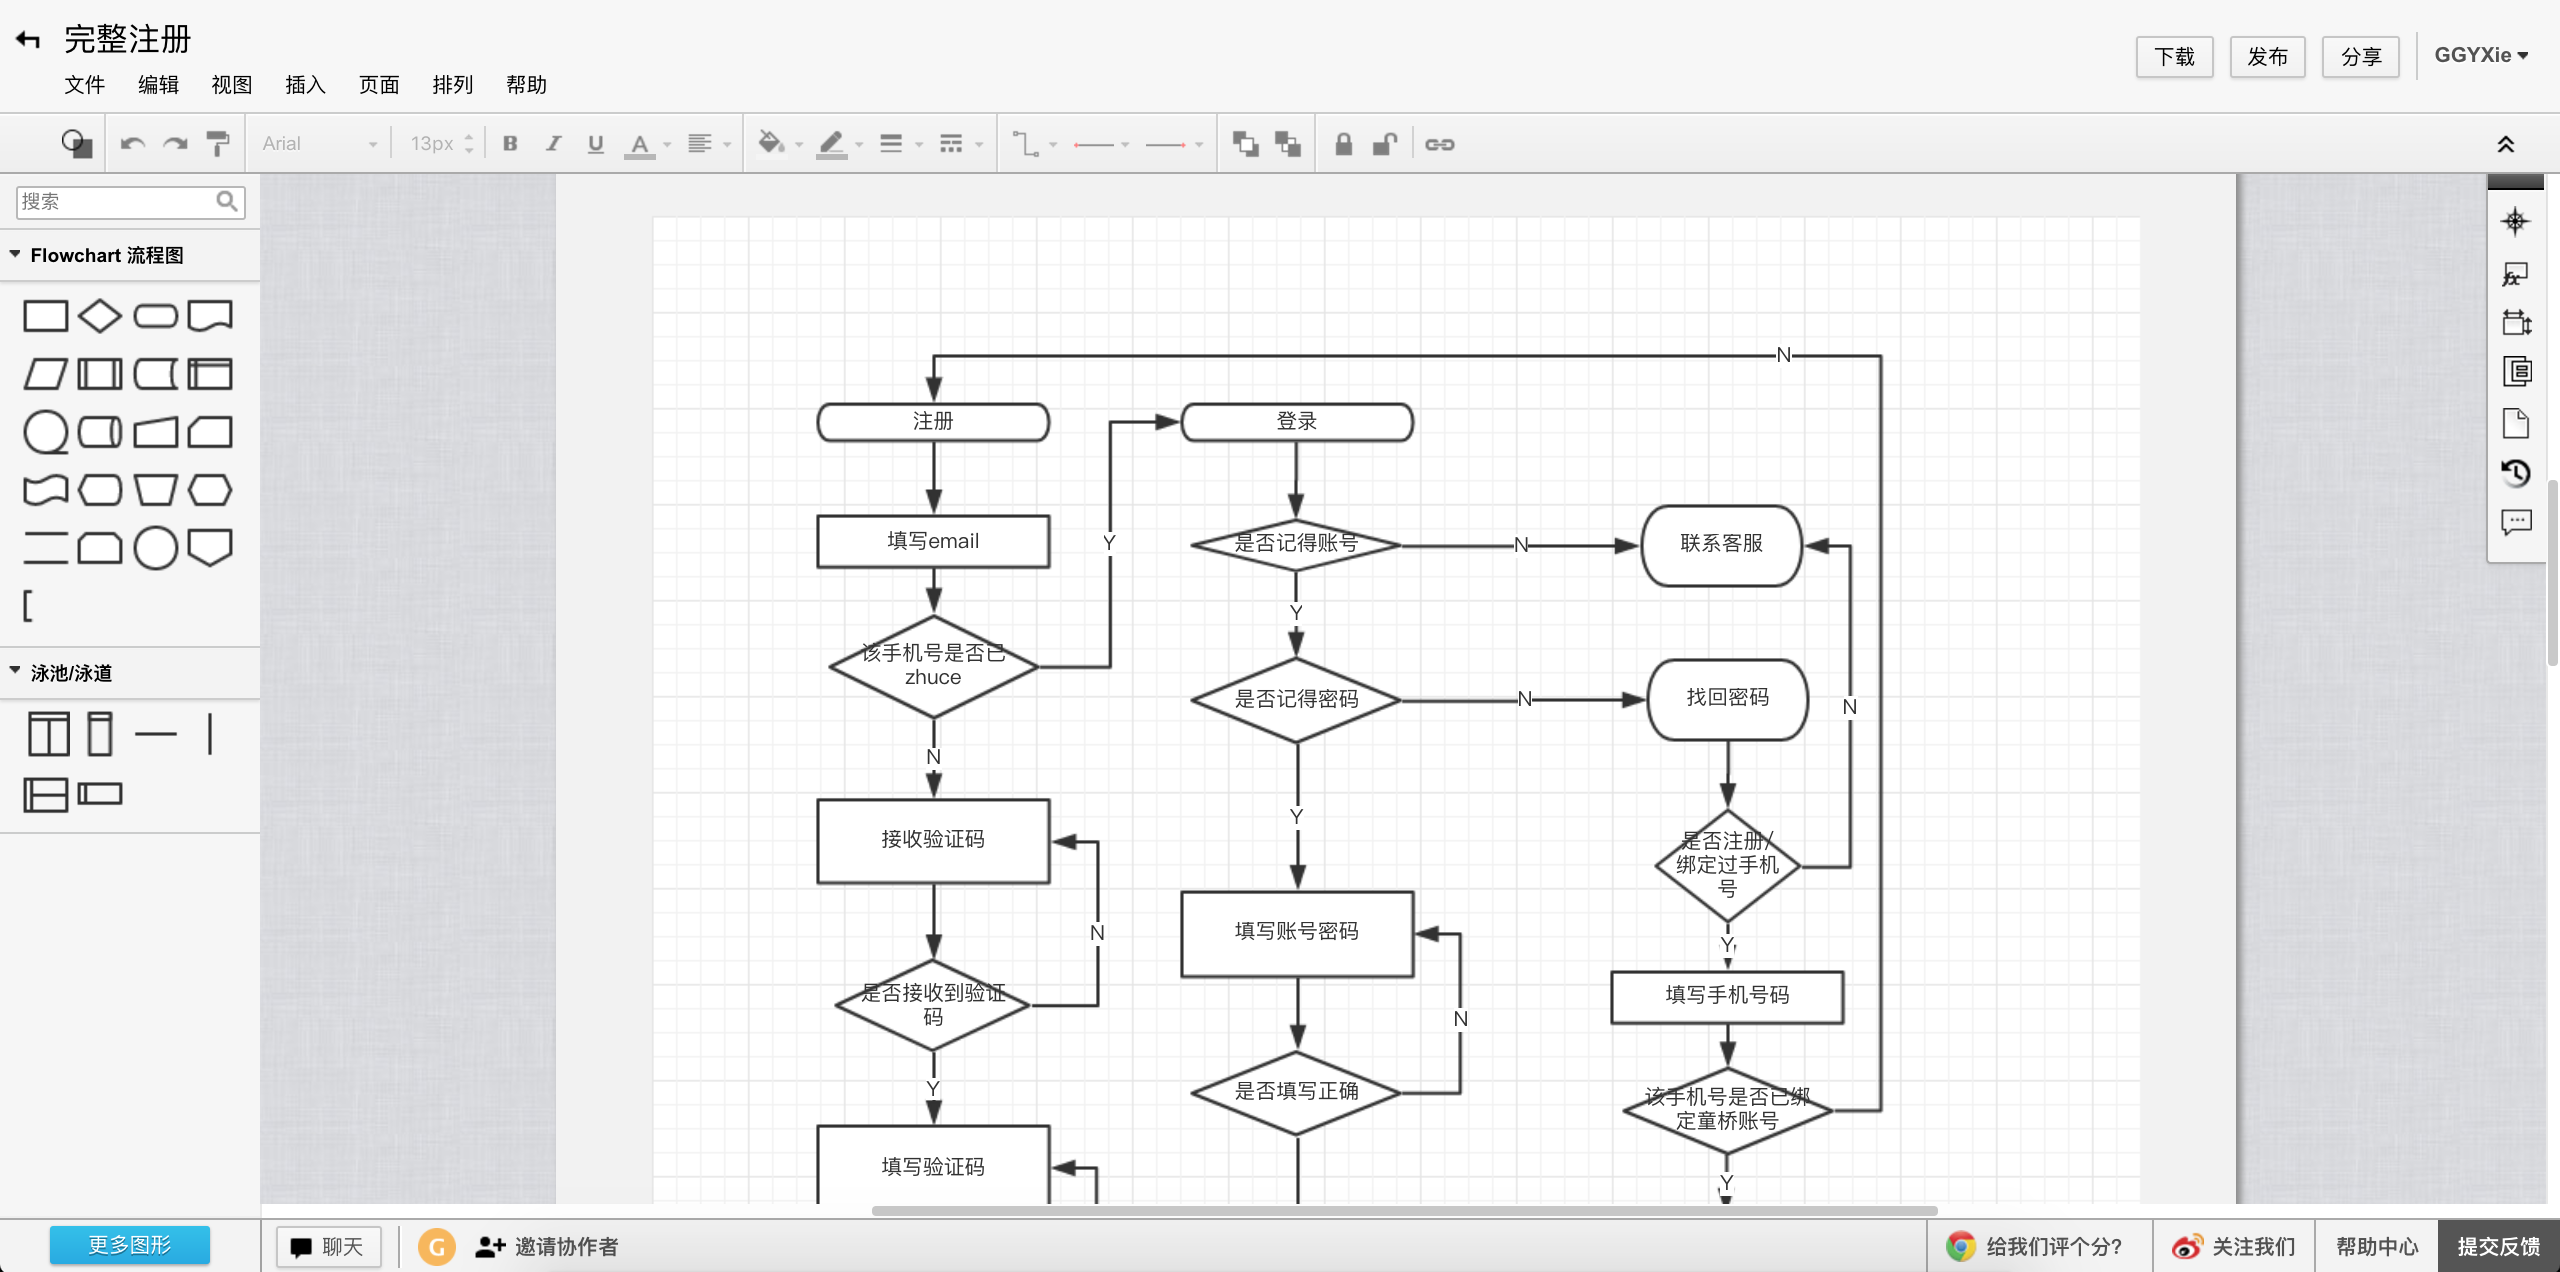
- Visio
Visio是微软出的一款绘图软件,现在是Office的一部分。微软的软件开发能力大家都懂得!唯一的缺点是收费。 - Excel
Excel大家都不陌生,就不赘述了。
编程类
Matplotlib
Matplotlib是Python下绘图的首选,用它可以绘制出高品质的图像。可以在这个页面gallery先睹为快。Matplotlib有完善的文档,可以参考根据文档里的例子很快地实现你要画的图像。下面是几个简单的例子:
ggplot2
ggplot2是R下绘图的标配,不二之选。MATLAB
MATLAB是一个优秀的商业软件,它的绘图能力同样强大。D3
D3是一个前端的绘图框架。有些情况下,网页是很好的图像呈现方式。因为可以开发一些可互动的可视化效果。
tikz
tikz是LaTex下非常强大的画图宏包。不过感觉只适合极客/科研党,因为本身用LaTex写作的人就少。查看Example。下面是官方的一个例子: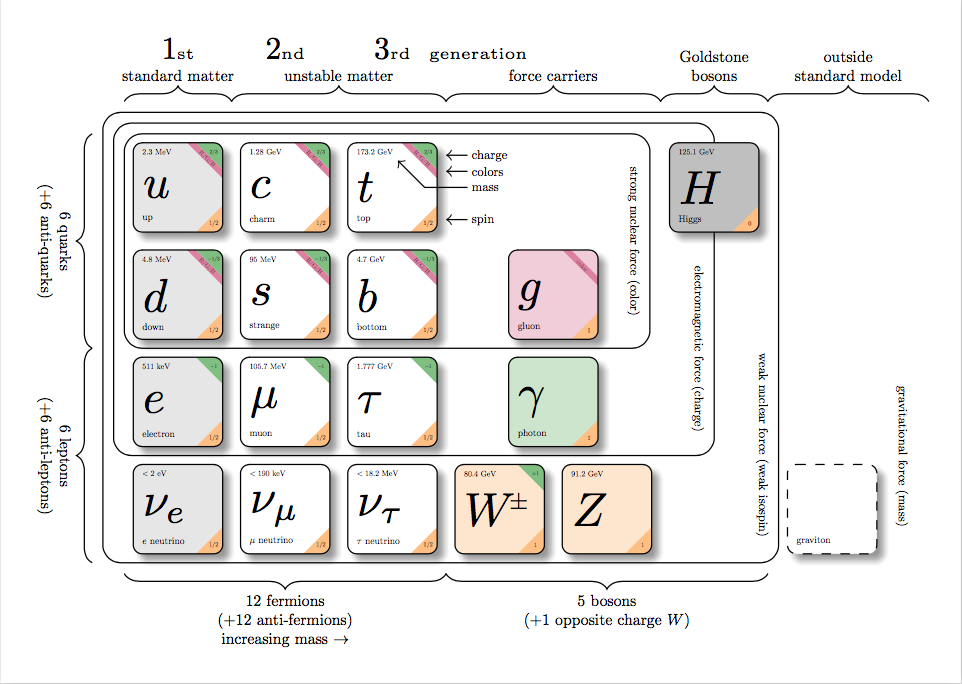
- SVG
SVG 意为可缩放矢量图形(Scalable Vector Graphics)。SVG 使用 XML 格式定义图像。
下面是SVG矩形的一个例子1
2
3
4
5
6
7
8
9
10
11
12<?xml version="1.0" standalone="no"?>
<!DOCTYPE svg PUBLIC "-//W3C//DTD SVG 1.1//EN"
"http://www.w3.org/Graphics/SVG/1.1/DTD/svg11.dtd">
<svg width="100%" height="100%" version="1.1"
xmlns="http://www.w3.org/2000/svg">
<rect width="300" height="100"
style="fill:rgb(0,0,255);stroke-width:1;
stroke:rgb(0,0,0)"/>
</svg>
Caffe编译
环境
- 系统:Ubuntu 16.04
遇到的问题
- 找不到protobuf的文件
原因:机器上装了Anaconda,而Anaconda默认装了很多东西,包括protobuf。
解决方案:注释掉.bashrc中的Anaconda的环境变量,然后重新开一个Terminal开始编译。 - 找不到hdf5的文件
解决方案:修改Makefile.config大致第九十几行的配置,加上hdf5的文件路径。1
2
3# Whatever else you find you need goes here.
INCLUDE_DIRS := $(PYTHON_INCLUDE) /usr/local/include /usr/include/hdf5/serial/
LIBRARY_DIRS := $(PYTHON_LIB) /usr/local/lib /usr/lib /usr/lib/x86_64-linux-gnu/hdf5/serial/
深入XGBoost
本文为作者原创文章,转载请注明出处。
模型学习
对每个刚接触XGBoost的同学,强烈建议先多读几遍这个文档:https://xgboost.readthedocs.io/en/latest//model.html。
安装
参考【3】
下载源码
1
git clone --recursive https://github.com/dmlc/xgboost
记得加
--recursive参数,这个仓库依赖了其他仓库编译
1
cd xgboost; cp make/minimum.mk ./config.mk; make -j4
安装Python包
1
cd python-package; sudo python setup.py install
特征映射
我们是以矩阵的形式将数据输入XGBoost模型,而这个矩阵是没有记录特征的名字。而在具体地数据分析中,我们必须知道每个特征对应的含义。这个时候就需要用到feature map文件了。
它的格式可以从这里查看:https://github.com/dmlc/xgboost/tree/master/demo/binary_classification#dump-model
Format of featmap.txt: \n:
- Feature id must be from 0 to number of features, in sorted order.
- i means this feature is binary indicator feature
- q means this feature is a quantitative value, such as age, time, can be missing
- int means this feature is integer value (when int is hinted, the decision boundary will be integer)
XGBoost的作者说了,feature map在训练的时候不会用到。
feature map was provided as a hint for what type the feature is. Such hint was not included during xgboost learning, so that was why a fmap needs to be passed in.
来自:https://github.com/dmlc/xgboost/issues/256#issuecomment-95791921
通过plot_importances函数,可以画出特征的重要性。查看plot_importances: https://github.com/dmlc/xgboost/blob/master/python-package/xgboost/plotting.py
这个方法的缺点是不支持特征映射,不过把源代码copy出来,稍微改一下就能支持啦。
代码如下:1
2
3
4
5
6
7
8
9
10
11
12
13
14
15
16
17
18
19
20
21
22
23
24
25
26
27
28
29
30
31
32
33
34
35
36
37
38
39
40
41
42
43
44
45
46
47
48
49
50
51
52
53
54
55
56
57
58
59
60
61
62
63
64
65
66
67
68
69
70
71
72
73
74
75
76
77
78
79
80
81
82
83
84
85
86
87
88
89
90
91
92
93
94
95
96
97
98
99
100
101
102
103
104
105
106
107
108# 添加一个fmap参数
def plot_importance(booster, ax=None, height=0.2,
xlim=None, ylim=None, title='Feature importance',
xlabel='F score', ylabel='Features',
importance_type='weight', max_num_features=None,
fmap=None,
grid=True, show_values=True, **kwargs):
"""Plot importance based on fitted trees.
Parameters
----------
booster : Booster, XGBModel or dict
Booster or XGBModel instance, or dict taken by Booster.get_fscore()
ax : matplotlib Axes, default None
Target axes instance. If None, new figure and axes will be created.
importance_type : str, default "weight"
How the importance is calculated: either "weight", "gain", or "cover"
"weight" is the number of times a feature appears in a tree
"gain" is the average gain of splits which use the feature
"cover" is the average coverage of splits which use the feature
where coverage is defined as the number of samples affected by the split
max_num_features : int, default None
Maximum number of top features displayed on plot. If None, all features will be displayed.
height : float, default 0.2
Bar height, passed to ax.barh()
xlim : tuple, default None
Tuple passed to axes.xlim()
ylim : tuple, default None
Tuple passed to axes.ylim()
title : str, default "Feature importance"
Axes title. To disable, pass None.
xlabel : str, default "F score"
X axis title label. To disable, pass None.
ylabel : str, default "Features"
Y axis title label. To disable, pass None.
show_values : bool, default True
Show values on plot. To disable, pass False.
kwargs :
Other keywords passed to ax.barh()
Returns
-------
ax : matplotlib Axes
"""
# TODO: move this to compat.py
try:
import matplotlib.pyplot as plt
except ImportError:
raise ImportError('You must install matplotlib to plot importance')
if isinstance(booster, XGBModel):
importance = booster.get_booster().get_score(importance_type=importance_type, fmap=fmap)
elif isinstance(booster, Booster):
importance = booster.get_score(importance_type=importance_type, fmap=fmap)
elif isinstance(booster, dict):
importance = booster
else:
raise ValueError('tree must be Booster, XGBModel or dict instance')
if len(importance) == 0:
raise ValueError('Booster.get_score() results in empty')
tuples = [(k, importance[k]) for k in importance]
if max_num_features is not None:
tuples = sorted(tuples, key=lambda x: x[1])[-max_num_features:]
else:
tuples = sorted(tuples, key=lambda x: x[1])
labels, values = zip(*tuples)
if ax is None:
_, ax = plt.subplots(1, 1)
ylocs = np.arange(len(values))
ax.barh(ylocs, values, align='center', height=height, **kwargs)
if show_values is True:
for x, y in zip(values, ylocs):
ax.text(x + 1, y, x, va='center')
ax.set_yticks(ylocs)
ax.set_yticklabels(labels)
if xlim is not None:
if not isinstance(xlim, tuple) or len(xlim) != 2:
raise ValueError('xlim must be a tuple of 2 elements')
else:
xlim = (0, max(values) * 1.1)
ax.set_xlim(xlim)
if ylim is not None:
if not isinstance(ylim, tuple) or len(ylim) != 2:
raise ValueError('ylim must be a tuple of 2 elements')
else:
ylim = (-1, len(values))
ax.set_ylim(ylim)
if title is not None:
ax.set_title(title)
if xlabel is not None:
ax.set_xlabel(xlabel)
if ylabel is not None:
ax.set_ylabel(ylabel)
ax.grid(grid)
return ax
plot_importance(bst, fmap='data/featmap.txt')
plt.tight_layout() # 解决feature名字太长,被遮住的问题。
plt.gcf().savefig('images/importances.png')
可视化
参考【1】1
plt.gcf().set_size_inches(150, 150)
需要安装graphviz1
brew install graphviz
1 | pip install graphviz |
1 | # plot decision tree |

通过参数num_trees可以指定画哪棵树:plot_tree(model, num_trees=4)
画出来的有可能有点模糊,一个解决方案是设置图片的大小。1
plt.gcf().set_size_inches(100,100)
用plot_tree这个方法画的图可能有些简陋,对于不熟悉graphviz的人来说很难做定制化。笔者的一个想法是将XGBoost训练好的模型的以Json的格式输出,然后用前端的方法进行定制化。下面的开始的一些尝试:
首先获取正确格式的Json。
1
2
3
4
5
6
7
8
9
10
11
12
13
14
15
16
17
18
19
20
21
22
23
24#!/usr/bin/python
import xgboost as xgb
### simple example
# load file from text file, also binary buffer generated by xgboost
dtrain = xgb.DMatrix('data/agaricus.txt.train')
dtest = xgb.DMatrix('data/agaricus.txt.test')
# specify parameters via map, definition are same as c++ version
param = {'max_depth': 2, 'eta': 1, 'silent': 1, 'objective': 'binary:logistic'}
# specify validations set to watch performance
watchlist = [(dtest, 'eval'), (dtrain, 'train')]
num_round = 2
bst = xgb.train(param, dtrain, num_round, watchlist)
# this is prediction
preds = bst.predict(dtest)
labels = dtest.get_label()
print('error=%f' % (sum(1 for i in range(len(preds)) if int(preds[i] > 0.5) != labels[i]) / float(len(preds))))
ret = bst.get_dump(fmap='data/featmap.txt', dump_format='json')
with open('model.json', 'w') as outfile:
outfile.write('[' + ','.join(ret) + ']')输出的json如下:
1
2
3
4
5
6
7
8
9
10
11
12
13
14
15
16
17
18
19
20
21
22
23
24
25
26
27
28
29
30
31
32
33
34
35
36
37
38
39
40
41
42
43
44
45
46
47
48
49
50
51
52
53
54
55
56
57
58
59
60
61
62
63
64
65
66
67
68
69
70
71
72
73
74
75[
{
"nodeid": 0,
"depth": 0,
"split": "odor=pungent",
"yes": 2,
"no": 1,
"children": [
{
"nodeid": 1,
"depth": 1,
"split": "stalk-root=cup",
"yes": 4,
"no": 3,
"children": [
{
"nodeid": 3,
"leaf": 1.71218
},
{
"nodeid": 4,
"leaf": -1.70044
}
]
},
{
"nodeid": 2,
"depth": 1,
"split": "spore-print-color=orange",
"yes": 6,
"no": 5,
"children": [
{
"nodeid": 5,
"leaf": -1.94071
},
{
"nodeid": 6,
"leaf": 1.85965
}
]
}
]
},
{
"nodeid": 0,
"depth": 0,
"split": "stalk-root=missing",
"yes": 2,
"no": 1,
"children": [
{
"nodeid": 1,
"depth": 1,
"split": "odor=pungent",
"yes": 4,
"no": 3,
"children": [
{
"nodeid": 3,
"leaf": 0.784718
},
{
"nodeid": 4,
"leaf": -0.96853
}
]
},
{
"nodeid": 2,
"leaf": -6.23624
}
]
}
]根据Json画图
特征重要性
如何知道XGBoost模型每个特征的重要性呢?使用get_fscore函数。
get_fscore(fmap=’’)
Get feature importance of each feature.
Parameters: fmap (str (optional)) – The name of feature map file
get_score(fmap=’’, importance_type=’weight’)
Get feature importance of each feature. Importance type can be defined as:
‘weight’ - the number of times a feature is used to split the data across all trees. ‘gain’ - the average gain of the feature when it is used in trees ‘cover’ - the average coverage of the feature when it is used in trees
– 来自【4】
当importance_type设置为weight,重要性的衡量方式是特征在树上出现的次数。
预测
首先看一下预测的Python API1
2
3
4
5
6
7
8
9
10
11
12
13
14
15
16
17predict(data, output_margin=False, ntree_limit=0, pred_leaf=False, pred_contribs=False)
'''
Predict with data.
NOTE: This function is not thread safe.
For each booster object, predict can only be called from one thread. If you want to run prediction using multiple thread, call bst.copy() to make copies of model object and then call predict
Parameters:
data (DMatrix) – The dmatrix storing the input.
output_margin (bool) – Whether to output the raw untransformed margin value.
ntree_limit (int) – Limit number of trees in the prediction; defaults to 0 (use all trees).
pred_leaf (bool) – When this option is on, the output will be a matrix of (nsample, ntrees) with each record indicating the predicted leaf index of each sample in each tree. Note that the leaf index of a tree is unique per tree, so you may find leaf 1 in both tree 1 and tree 0.
pred_contribs (bool) – When this option is on, the output will be a matrix of (nsample, nfeats+1) with each record indicating the feature contributions of all trees. The sum of all feature contributions is equal to the prediction. Note that the bias is added as the final column, on top of the regular features.
Returns:
prediction
Return type:
numpy array
'''
细读几个参数:
pred_leaf=True会输出每条数据落在哪些叶子上pred_contribs=True会输出每条数据中每个特征对最后结果做的贡献。这些特征贡献值加起来就是预测值。
通过输出不同的信息可以对数据进行更细致的分析。
参考
Python多线程爬虫案例解析
本文为作者原创文章,转载请注明出处。
工具
爬网页的一个很重要的工具就是对网页进行分析,所以熟悉Chrome的开发者工具使用很重要(其实很简单,不要被吓到。)
- 使用Chrome可以查看网页的html源码

- 使用Chrome开发者工具可以查看网页指定部分的源码

Python包
Python有很多有用的爬虫工具包,这里只使用两个最基本的包(入门简单最好了)。
- urllib2
用来获取网页的源码。简单地可以理解为:你填一个url,它给你返回网页代码。 - pyquery
主要用来定位找到我们感兴趣的html代码。
案例背景
一亩三分地论坛上有很多留学申请的录取信息,包含申请者的三维条件和录取情况,可以用来分析学校的录取条件等信息。
步骤
获得我们要爬的所有网页的URL
http://www.1point3acres.com/bbs/forum-82-1.html这个网页是该论坛录取汇报的入口。

首先我们确定一下有多少录取汇报帖子。
查看网页源码定位到下面这段html代码。1
<a class="bm_h" href="javascript:;" rel="forum.php?mod=forumdisplay&fid=82&sortid=164&%1=&sortid=164&page=2" curpage="1" id="autopbn" totalpage="1000" picstyle="0" forumdefstyle="">下一页 »</a>
下面这行代码获取帖子数。
1
num = int(doc('#autopbn').attr('totalpage'))# 获取页数
观察帖子的URL可以看到不用的帖子的区别在于后面的数据不同,而且这个数子的范围就在上面获取的帖子数内,所以我们就很容易可以构造出我们的真正要爬的网页的URL。
1
page_url = 'http://www.1point3acres.com/bbs/forum-82-%s.html' % index
设置多线程
根据系统的核数设置线程的数目。开启多线程可以加快我们的爬取速度。1
pool = Pool(8)
爬取网页
上面已经拿到了所有的URL。根据这个URL用urllib2去获取网页内容就可以了。1
2page = urllib2.urlopen(url)
content = page.read()解析网页
其实上面已经用到了解析的方法,就是采用pyquery去定位到我们感兴趣的内容。保存数据
解析到网页后可以设计好一定的格式去保存数据。建议采用CSV格式,即以逗号分隔。这个格式Excel也可以很方面的打开处理。
数据清理及分析
爬下来的数据可能包含一些脏数据,可以用正则表达式来做数据清洗。(下次有时间我会写一篇关于正则表达式方面的经验。)
完整源码
1 | #!/usr/bin/python |
这篇文章是针对非计算机专业的同学写的,如果有不清楚的地方欢迎在下面留言。我会不断完善这篇文章,希望能帮到大家。
抽取PDF的繁体字并转成简体字
本文为作者原创文章,转载请注明出处。
场景
手头上有一个PDF,里面的文字是繁体字,现在需要使用这些文字,但是必须是简体字。
解决方案
首先抽取PDF中文字
使用Apache的Pdfbox包。这个包是进行PDF处理的很好的解决方案,目前这个包还在不断更新中。1
2
3
4
5
6
7
8
9
10
11
12
13
14
15
16
17
18
19
20
21
22
23
24
25
26
27
28
29
30
31
32
33
34
35
36
37
38
39
40
41
42
43
44
45
46
47
48
49
50
51
52
53
54
55
56
57
58
59
60
61
62
63
64
65
66
67
68
69
70
71
72
73
74
75
76
77
78
79
80
81
82
83
84
85
86
87
88
89
90
91
92
93
94
95
96
97
98
99import org.apache.pdfbox.pdfparser.PDFParser;
import org.apache.pdfbox.pdmodel.PDDocument;
import org.apache.pdfbox.util.PDFTextStripper;
import java.io.*;
public class PdfboxUtil {
/**
* @param args
*/
public static void main(String[] args) {
String pdfPath = "/Users/xxx/Downloads/xxx.pdf";
String txtfilePath = "/Users/xxx/Downloads/xxx.txt";
PdfboxUtil pdfutil = new PdfboxUtil();
try {
String content = pdfutil.getTextFromPdf(pdfPath);
pdfutil.toTextFile(content, txtfilePath);
System.out.println("Finished !");
} catch (Exception e) {
e.printStackTrace();
}
}
/**
* 读取PDF文件的文字内容
* @param pdfPath
* @throws Exception
*/
public String getTextFromPdf(String pdfPath) throws Exception {
// 是否排序
boolean sort = false;
// 开始提取页数
int startPage = 1;
// 结束提取页数
int endPage = Integer.MAX_VALUE;
String content = null;
InputStream input = null;
File pdfFile = new File(pdfPath);
PDDocument document = null;
try {
input = new FileInputStream(pdfFile);
// 加载 pdf 文档
PDFParser parser = new PDFParser(input);
parser.parse();
document = parser.getPDDocument();
// 获取内容信息
PDFTextStripper pts = new PDFTextStripper();
pts.setSortByPosition(sort);
endPage = document.getNumberOfPages();
System.out.println("Total Page: " + endPage);
StringBuilder sb = new StringBuilder();
for(int i = 1; i<= endPage; i++){
pts.setStartPage(i);
pts.setEndPage(i);
try {
String page = pts.getText(document);
sb.append("\n\n###############################第"+ i +"页###############################\n\n");
sb.append(page);
} catch (Exception e) {
throw e;
}
}
content = sb.toString();
} catch (Exception e) {
throw e;
} finally {
if (null != input)
input.close();
if (null != document)
document.close();
}
return content;
}
/**
* 把PDF文件内容写入到txt文件中
* @param pdfContent
* @param filePath
*/
public void toTextFile(String pdfContent,String filePath) {
try {
File f = new File(filePath);
if (!f.exists()) {
f.createNewFile();
}
System.out.println("Write PDF Content to txt file ...");
BufferedWriter output = new BufferedWriter(new FileWriter(f));
output.write(pdfContent);
output.close();
} catch (Exception e) {
e.printStackTrace();
}
}
}注意这段代码使用的1.8.10版本的pdfbox,使用2.x以上版本有兼容问题
贴出maven依赖,省得大家找了。1
2
3
4
5<dependency>
<groupId>org.apache.pdfbox</groupId>
<artifactId>pdfbox</artifactId>
<version>1.8.10</version>
</dependency>繁体字转简体
OpenCC是一个开源python包,可以实现简繁体字互转。1
2
3
4
5
6
7
8
9
10
11
12
13
14
15
16# -*- encoding=utf-8 -*-
from opencc import OpenCC
openCC = OpenCC('t2s')
input_file = open("xxx.txt", "r")
output_file = open("xxx_sim.txt", "w")
for l in input_file.readlines():
# l = l.strip()
print(l)
converted = openCC.convert(l)
output_file.write(converted)
print(converted)
input_file.close()
output_file.close()
工具化
上面的方案采用了java+python两种编程语言,代码也写死了。如果经常有这个需要,可以考虑做一个工具,使用统一的语言。比如,将pdf抽取文字的工作也用python实现(可以用pdfminer包)。


